
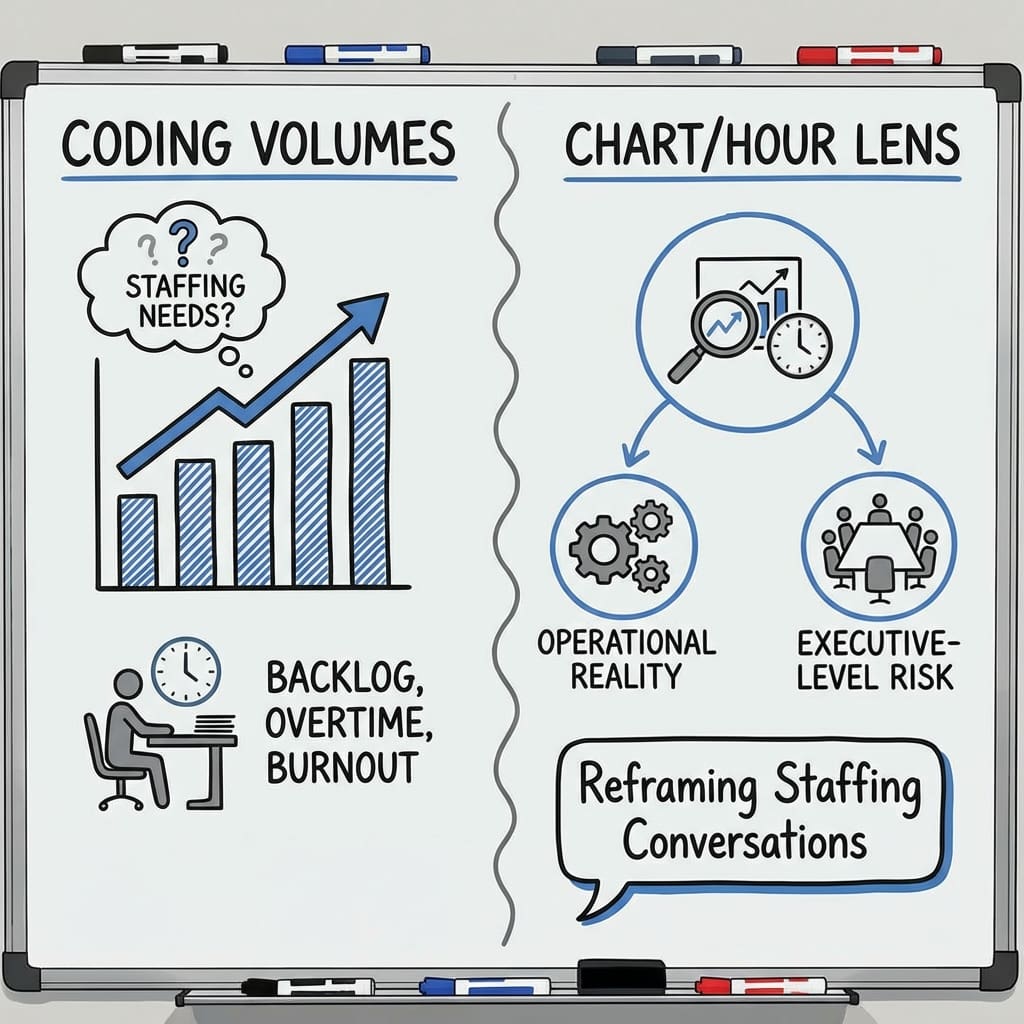
From volume to reality
One of the most common conversations I have with organizations early in an engagement starts the same way:
“We know our volumes — we just aren’t sure how many people we actually need.”
Most leaders can confidently report encounter counts and service line volumes. What’s often missing is the translation layer; the ability to convert volume into a credible, defensible FTE requirement that resonates with executive leadership.
When that translation doesn’t happen well, the consequences are familiar:
- Persistent backlogs
- Extended accounts receivable (AR) days
- Chronic overtime spend
- Burnout among high-performing staff
A chart/hour model, when used correctly, isn’t about pushing productivity, it’s about evaluating staffing reality in a way that is transparent, explainable, and operationally sound.
Why volume alone isn’t enough
Volume answers how much work exists.
Staffing answers how much work can realistically be completed.
Without a structured way to bridge those two, organizations tend to rely on:
- Historical staffing levels that no longer match current complexity
- Assumptions that productivity is uniform across record types
- Overtime as a permanent operating strategy rather than a short-term tool
Executives understandably ask, “Why do we need more people if volumes haven’t changed?”
The answer is rarely intuitive, unless the staffing model accounts for how work is actually performed.

The chart/hour model as an evaluation tool
A chart/hour framework is most effective when positioned as a capacity analysis, not a performance mandate. It helps answer three executive-level questions:
- How many productive hours does each FTE actually have?
- What does the work realistically require based on encounter type and complexity?
- Where is the gap between demand and capacity…and what is it costing us?
This approach creates clarity without placing blame on teams or oversimplifying the work they do.
Start with reality: available work hours
Most staffing discussions begin with the assumption of a 2,080-hour work year. That’s a useful starting point — but only a starting point.
In practice, productive hours are reduced by:
- Earned PTO accruals
- Observed company holidays
- Education and training
- Meetings, huddles, and operational touchpoints
- Required non-coding activities
For many organizations, this brings the average annual productive hours per coding FTE closer to 1,900–1,950, sometimes lower depending on benefit structure and operational expectations.
This is where staffing models often quietly fail: leaders plan to cover volumes with hours that don’t truly exist.

Account for non-productive but necessary time
Another common gap is the assumption that all productive hours are interchangeable with coding hours.
In reality, coders are expected to spend time on:
- Provider communication or query follow-up
- Data abstraction outside core coding tasks
- Audit response or quality oversight
- Meetings and cross-functional activities
These activities are essential, but they are not captured in chart/hour productivity targets. When this isn’t factored in, organizations unintentionally under-resource the work and compensate through overtime or backlog acceptance.
Understanding the work: productivity benchmarks as reference points
To evaluate staffing accurately, leaders need reasonable productivity ranges by encounter type. These benchmarks should be viewed as directional, not prescriptive. Actual performance will vary based on case complexity, documentation quality, technology, and local workflows.
Facility coding – approximate productivity ranges
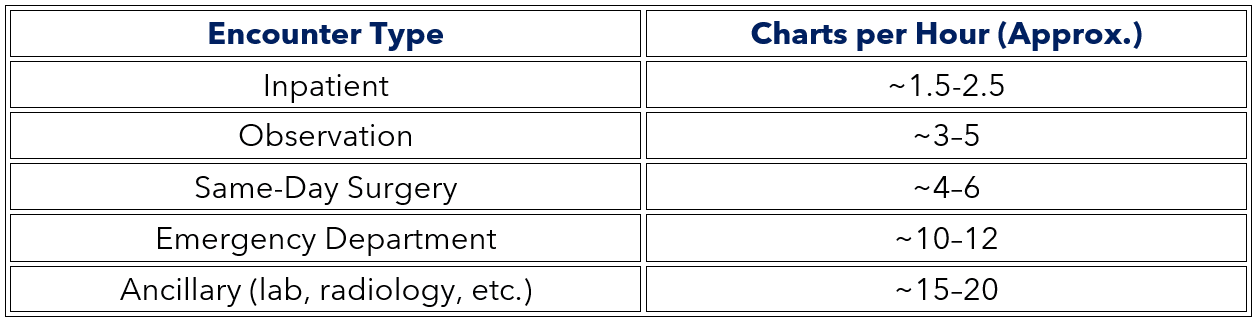
These ranges assume fully trained coders working within stable workflows. High-acuity populations, poor documentation, frequent queries, or dual coding responsibilities will materially reduce throughput.
Professional fee (ProFee) coding – approximate productivity ranges
Professional coding productivity is highly dependent on specialty, documentation consistency, and payer mix. As a result, ranges are intentionally broad.
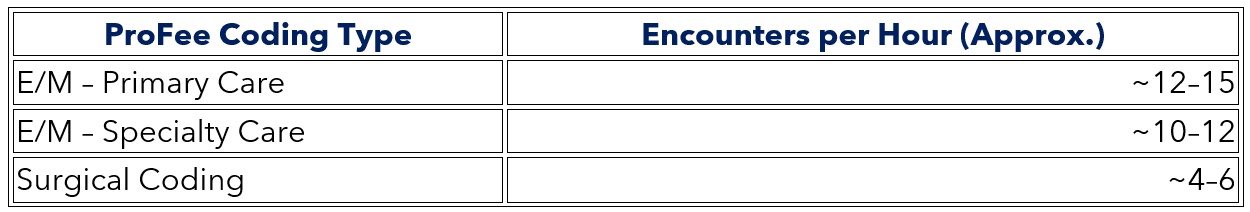
Surgical coding generally requires more time due to operative note review, bundling rules, and modifier application, while non-surgical encounters may move more quickly when documentation is standardized.
Working backward to FTE need
Rather than asking, “How many charts can one person code?”, a more effective framing is:
This means:
- Starting at 2,080 hours
- Subtracting PTO, holidays, and annual expected non-productive time
- Applying reasonable productivity ranges by encounter type
- Comparing required hours to available hours
When this math is done transparently, leaders can clearly show where gaps exist — even when overall volumes appear unchanged.

Why this matters to executives
Executives don’t need to be coding experts, they need to understand risk, cost, and sustainability.
A staffing evaluation grounded in realistic productivity expectations allows leaders to articulate:
- Why overtime is not a long-term solution
- How backlogs translate into AR delays and cash-flow impact
- Why quality and compliance erode under chronic capacity strain
- What additional staffing will prevent, not just what it will cost
This shifts the conversation from requesting headcount to managing operational and financial risk.
Closing thought
When organizations know their volumes but not their staffing reality, they pay for the gap; in overtime, delayed revenue, and exhausted teams.
A chart/hour model, used thoughtfully, brings clarity to that gap. It gives leaders a common language to evaluate capacity, explain need, and advocate effectively — without reducing the work to a simplistic productivity target.
In the mid-revenue cycle, clarity is not optional, it’s foundational.